
")
")
Bathymetric maps show the depth and the underwater seascape structure. They are commonly used for navigation safety (ports, navigation channels), scientific purpose, dredging operations (by evaluating the sediment volume to remove) and underwater works.
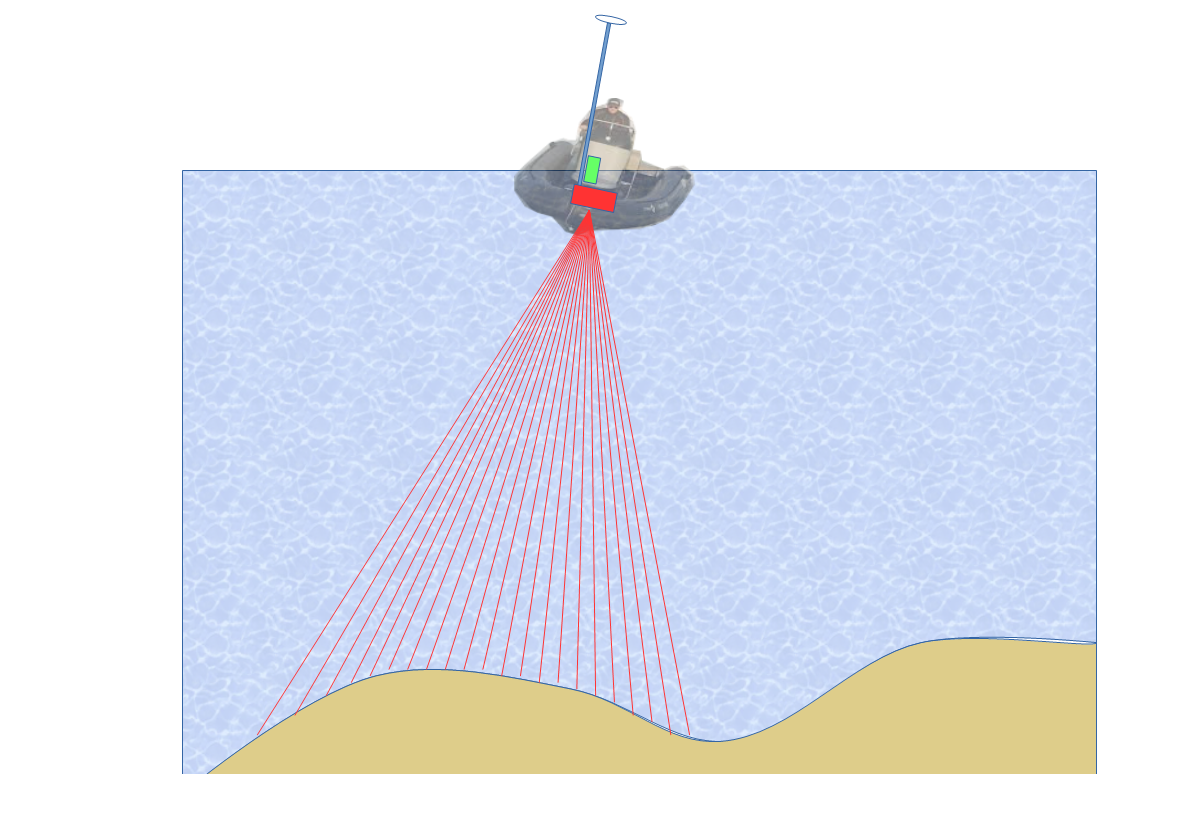
We perform these measurements by using:
- A multibeam echo sounder which measurements the distance of the bottom echo along a specific direction. These distances are measure in the sounder spatial reference
- An inertial navigation unit coupled to the sounder which provides the orientation of the latter in the terrestrial reference system. This is an essential device of which the measurements' quality is dependant
- a RTK GPS also coupled wit the sounder which provides the position of the latter in the terrestrial reference system. In order to have a precision of 2 cm a second GPS located on land is compulsory for the RTK mod
- a software which computes all measurements to position sounder echo in a terrestrial reference system
- for a better measurement precision, a celerimeter measures the speed of sound at the level of the sounder
- when the speed of sound is not homogeneous (fresh water resurgence, temperature) a second celerimeter is used to generate profiles and adjust sound wave diffraction
From these measurements and according to user's wishes we are able to generate:
Digital elevation model (DEM)
This corresponds to a computer file (.xyz or other) encompassing a depth data grid (50 cm for example) . These data are essential for the costumers wishing to perform specific calculation (scientists for instance).
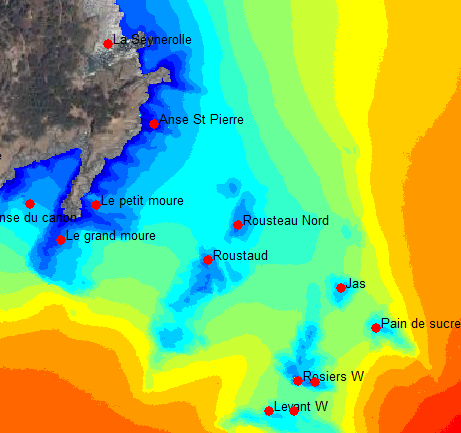
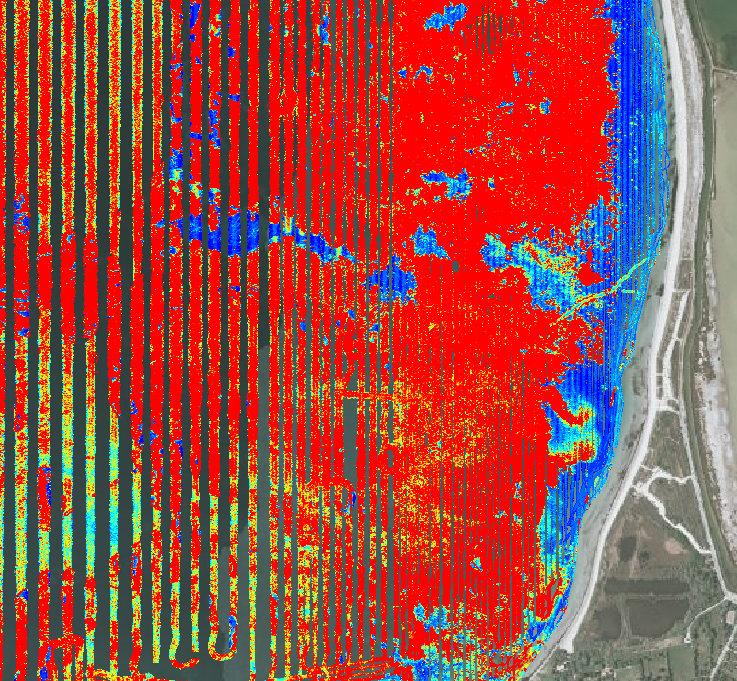
Colour map
They show the depth in every point using a colour code. These maps are very useful to have a quick viewpoint of the seascape structure or to detect voluminous objects.
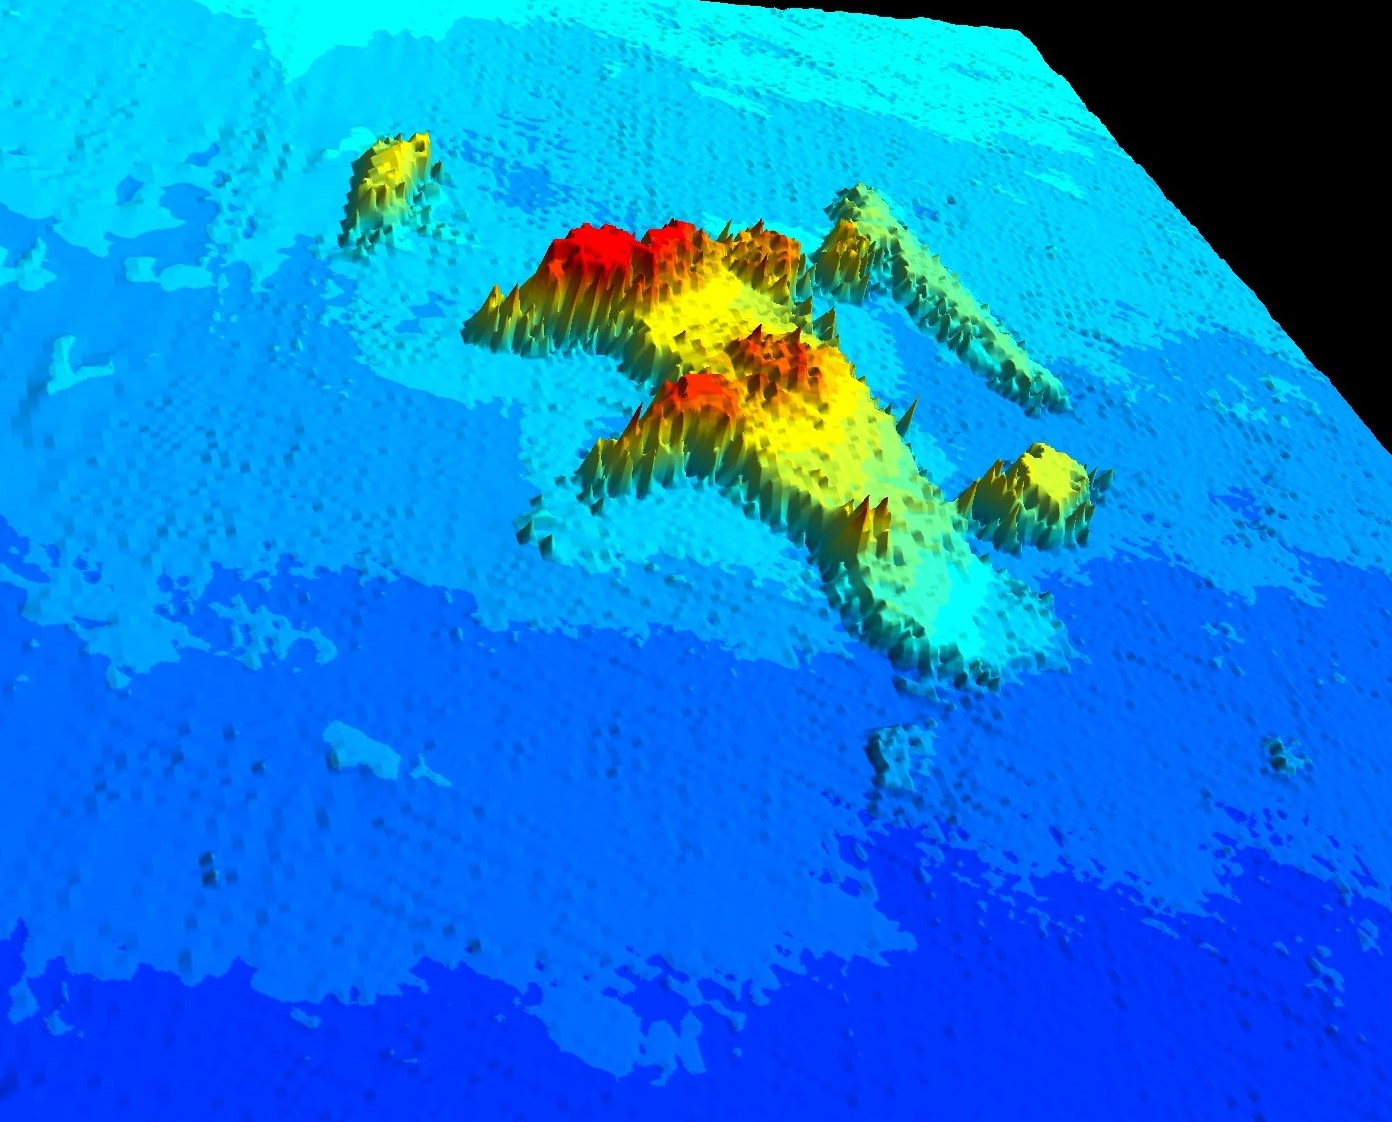
3D views
They are perspective views of the colour maps. They allow a better interpretation of the seascape but do not provide a precise localization on the map of the structures observed.
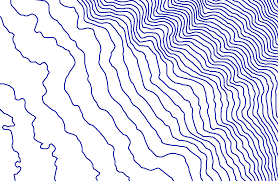
Bathymetric lines
They represent depth curves. This is the most common graphic representation of depth (used on marine maps). Bathymetric lines allow to :
- visualize the depth numerical value
- simultaneously show other information on the same map (sonar mosaic, marine habitats)
Roughness maps
This representation allows to classify the bottom nature using a discrimination index based on the data collected by the echo sounder and its water column mod.